95. VMware vCenter
NXLog can be used to capture and process logs from VMware vCenter. This guide explains how to do this with vCenter 5.5 installed on Windows Server 2008 R2.
vCenter logs can be processed in two ways.
-
NXLog can be installed directly on the vCenter host machine and configured to collect all logs locally. This method provides more feedback and more detailed logs, and is the recommended method. See Local vCenter Logging.
-
Alternatively, vCenter logs can be collected remotely using the vSphere Perl SDK. This option is less flexible, but may be the only feasible option in some environments due to security restrictions. See Remote vCenter Logging.
95.1. Local vCenter Logging
-
Install NXLog on the vCenter host machine.
-
Log in to the vCenter client.
-
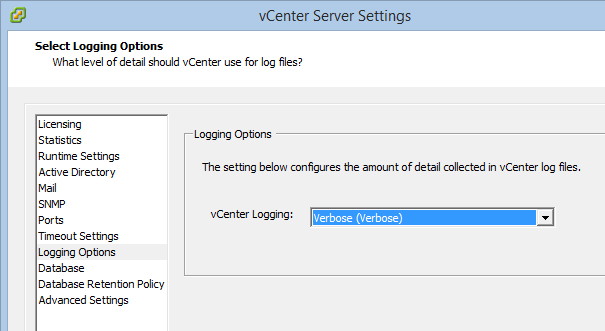
Open , select Logging Options from the list on the left, and set vCenter Logging to Verbose (Verbose).
-
Click OK to save your changes. vCenter will now start writing detailed logs. The location of the logs depends on the version of vCenter you are running.
-
vCenter Server 5.x and earlier versions on Windows XP, 2000, and 2003:
%ALLUSERSPROFILE%\Application Data\VMware\VMware VirtualCenter\Logs\ -
vCenter Server 5.x and earlier versions on Windows Vista, 7, and 2008:
C:\ProgramData\VMware\VMware VirtualCenter\Logs\ -
vCenter Server 5.x Linux Virtual Appliance:
/var/log/vmware/vpx/ -
vCenter Server 5.x Linux Virtual Appliance UI:
/var/log/vmware/vami/NoteIf vCenter is running under a specific user account, then the logs may be located in the profile directory of that user, instead of %ALLUSERSPROFILE%.
-
-
Determine which log files you want to parse and collect.
Table 35. VMware vCenter Log Files (Source) Log File Name Usage vpxd.log
The main vCenter Server logs, consisting of all vSphere Client and WebServices connections, internal tasks and events, and communication with the vCenter Server Agent (vpxa) on managed ESX/ESXi hosts.
vpxd-profiler.log, profiler.log
Profiled metrics for operations performed in vCenter Server. Used by the VPX Operational Dashboard (VOD) accessible at
https://VCHost/vod/index.html.vpxd-alert.log
Non-fatal information logged about the vpxd process.
cim-diag.log and vws.log
Common Information Model monitoring information, including communication between vCenter Server and managed hosts’ CIM interface
drmdump (directory)
Actions proposed and taken by VMware Distributed Resource Scheduler (DRS), grouped by the DRS-enabled cluster managed by vCenter Server. These logs are compressed.
ls.log
Health reports for the Licensing Services extension, connectivity logs to vCenter Server.
vimtool.log
Dump of string used during the installation of vCenter Server with hashed information for DNS, username and output for JDBC creation.
stats.log
Provides information about the historical performance data collection from the ESXi/ESX hosts
sms.log
Health reports for the Storage Monitoring Service extension, connectivity logs to vCenter Server, the vCenter Server database and the xDB for vCenter Inventory Service.
eam.log
Health reports for the ESX Agent Monitor extension, connectivity logs to vCenter Server.
catalina.date.log and localhost.date.log
Connectivity information and status of the VMware Webmanagement Services.
jointool.log
Health status of the VMwareVCMSDS service and individual ADAM database objects, internal tasks and events, and replication logs between linked-mode vCenter Servers.
NoteThe various log files use different formats. You must examine your chosen file in order to determine how to parse its entries. The main log file,
vpxd.log, contains all login and management information. This file will be used as an example. The file has the general format oftimestamp [tag-1] [optional-tag-2] message, and the message part might contain a multi-line trace.vpxd.log Sample2014-06-13T22:44:46.878-07:00 [04372 info 'Default' opID=DACDA564-00000004-7c] [Auth]: User Administrator 2014-06-13T23:15:07.222-07:00 [04136 error 'vpxdvpxdMain'] [Vpxd::ServerApp::Init] Init failed: VpxdVdb::Init(VpxdVdb::GetVcVdbInstId(), false, false, NULL) --> Backtrace: --> backtrace[00] rip 000000018018a8ca --> backtrace[01] rip 0000000180102f28 --> backtrace[02] rip 000000018010423e --> backtrace[03] rip 000000018008e00b --> backtrace[04] rip 00000000003c5c2c --> -
Configure and restart NXLog.
In the configuration below, the xm_multiline extension module is used with the HeaderLine directive to parse log entries even when they span multiple lines. An Exec directive is used to drop all empty lines. A regular expression with matching groups adds fields to the event record from each log message, and the resulting log entries are sent to another host via TCP in JSON format.
  1
2
3
4
5
6
7
8
9
10
11
12
13
14
15
16
17
18
19
20
21
22
23
24
25
26
27
28
29
30
31
32
33

  <Extension vcenter>
    Module      xm_multiline
    HeaderLine  /(?x)(\d+-\d+-\d+T\d+:\d+:\d+).\d+-\d+:\d+\s+\[(.*?)\]\s+ \
                 (?:\[(.*?)\]\s+)?(.*)/
    Exec        if $raw_event =~ /^\s+$/ drop();
</Extension>

<Extension _json>
    Module      xm_json
</Extension>

<Input in>
    Module      im_file
    File        "C:\ProgramData\VMware\VMware VirtualCenter\Logs\vpxd*.log"
    InputType   vcenter
    <Exec>
        if $raw_event =~ /(?x)(\d+-\d+-\d+T\d+:\d+:\d+.\d+-\d+:\d+)\s+\[(.*?)\]\s+
                          (?:\[(.*?)\]\s+)?((.*\s*)*)/
        {
            $EventTime = parsedate($1);
            $Tag1 = $2;
            $Tag2 = $3;
            $Message = $4;
        }
    </Exec>
</Input>

<Output out>
    Module      om_tcp
    Host        192.168.1.1
    Port        1514
    Exec        to_json();
</Output>
{
  "EventReceivedTime": "2017-04-29 13:46:49",
  "SourceModuleName": "vcenter_in1",
  "SourceModuleType": "im_file",
  "EventTime": "2014-06-14 07:44:46",
  "Tag1": "04372 info 'Default' opID=DACDA564-00000004-7c",
  "Tag2": "",
  "Message": "[Auth]: User Administrator"
}
{
  "EventReceivedTime": "2017-04-29 13:46:49",
  "SourceModuleName": "vcenter_in1",
  "SourceModuleType": "im_file",
  "EventTime": "2014-06-14 08:15:07",
  "Tag1": "04136 error 'vpxdvpxdMain'",
  "Tag2": "Vpxd::ServerApp::Init",
  "Message": "Init failed: VpxdVdb::Init(VpxdVdb::GetVcVdbInstId(), false, false, NULL)\n--> Backtrace:\n--> backtrace[00] rip 000000018018a8ca\n--> backtrace[01] rip 0000000180102f28\n--> backtrace[02] rip 000000018010423e\n--> backtrace[03] rip 000000018008e00b\n--> backtrace[04] rip 00000000003c5c2c\n-->\n"
}
95.2. Remote vCenter Logging
This method of capturing vCenter logs uses a Perl script with the vSphere SDK. The script periodically connects to the vCenter server and retrieves logs.
-
Download and install the latest Perl runtime and the vSphere SDK for Perl. For Windows, the vSphere CLI is recommended instead, because it includes the required Perl runtime environment and VIperl libraries.
-
The script will use a timestamp file to store the timestamp of the most recently downloaded log entry. The timestamp ensures that even if the vCenter server is restarted, NXLog can correctly resume log collection. The timestamp file will be created automatically. However, to specify a timestamp manually, create a file with a timestamp in
yyyy-mm-ddThh-mmformat (for example,2017-01-19T18:00). Then use the-roption to specify the location of the timestamp file. Any logs with earlier timestamps will be skipped. -
To test the
vcenter.plscript with the vCenter host, run the script as shown below. Substitute the correct server IP address and credentials for the vCenter server. The-targument is optional and can be used to adjust the time between polls (the default of 60 seconds is the minimum recommended). The-rargument is also optional and can be used to specify a custom location for the timestamp file. Events such as connection or authentication errors are logged to standard output.$ perl vcenter.pl -s=serverip -u=username -p=password -t=pollinterval \ -r=timestampfile
|
Note
|
Because the script connects to vCenter remotely, we recommend setting up a dedicated user in vCenter as a security measure. |
This configuration uses the im_exec module to run the Perl script
and accept logs from its standard output. The xm_json module is
used to parse the JSON event data. The $EventTime field is converted to a
datetime value.
  1
2
3
4
5
6
7
8
9
10
11
12
13
14
15
16
17
18
19
20
21
22
23
24
25

  <Extension _json>
    Module      xm_json
</Extension>

<Input in>
    Module      im_exec
    # For users who have the VMware CLI installed:
    Command     "C:\Program Files (x86)\VMware\VMware vSphere CLI\Perl\bin\perl.exe"
    # For Linux and regular Perl users this would be sufficient:
    #Command    perl
    Arg         "C:\scripts\vcenter.pl"
    Arg         -u
    Arg         <username>
    Arg         -p
    Arg         <password>
    Arg         -s
    Arg         <server_ip_addr>
    <Exec>
        # Parse JSON into fields for later processing if required
        parse_json();

        # Parse EventTime field as timestamp
        $EventTime = parsedate($EventTime);
    </Exec>
</Input>
{
  "EventTime": "2014-06-20T18:00:00.163Z",
  "Message": "User Administrator@192.168.71.1 logged in as VI Perl",
  "UserName": "Administrator"
}
{
  "EventTime": "2014-06-20T10:56:23",
  "Message": "Error: Cannot complete login due to an incorrect user name or password.",
  "UserName": "Administrator"
}#!/usr/bin/perl -w
use Encode;
use VMware::VIRuntime;
use VMware::VILib;
use Getopt::Long;
use IO::File;
use POSIX;
my $startTime;
my $stopTime;
my $server;
my $sleepTime = 60;
my $userName;
my $passWord;
my $timeStamp;
my $timeStampFile = "timestamp.txt";
my $timeNow;
my $optRs = GetOptions('s=s'=>\$server, 'u=s'=>\$userName, 'p=s'=>\$passWord, 't=s'=>\$sleepTime, 'r=s'=>\$timeStampFile);
Getopt::Long::Configure("pass_through");
if((not defined $server) or (not defined $userName) or (not defined $passWord)){
print "Usage: -s=server.ip.addr -u=username -p=password -t=pollinterval(seconds, optional, default=$sleepTime) -r=timestampfile (optional, default=$timeStampFile, format:%Y-%m-%dT%H:%M:%S)";
exit;
}
my $file = new IO::File("< $timeStampFile");
if (defined $file) {
my ($line);
while (<$file>) {
$line = $_;
if ($line =~ /^#/) {next;} else {last;}
}
if (not ($line =~ /^#/)) {
$startTime=$line;
$startTime=~s/[\n]+//g;
}
$file->close();
}
$ENV{'VI_SERVER'}=$server;
$ENV{'VI_USERNAME'}=$userName;
$ENV{'VI_PASSWORD'}=$passWord;
my %opts = (
vmname => {
type => "=s",
variable => "name",
help => "Name of the Virtual Machine",
required => 0
},
);
Opts::add_options(%opts);
Opts::parse();
Opts::validate();
while (1) {
$timeNow = substr(POSIX::strftime('%Y-%m-%dT%H:%M:%S',localtime(time)),0,19);
if(not defined $startTime) {
$startTime = substr(POSIX::strftime('%Y-%m-%dT%H:%M:%S',localtime(time-$sleepTime)),0,19);
}
$stopTime = $timeNow;
eval{
Util::connect()
};
if($@){
print "{\"EventTime\":\"$timeNow\",\"Message\":\"$@\",\"UserName\":\"$userName\"}\n";
}
eval{
getLog()
};
if($@){
print "{\"EventTime\":\"$timeNow\",\"Message\":\"$@\",\"UserName\":\"$userName\"}\n";
}
eval{
Util::disconnect()
};
sleep($sleepTime);
}
sub getLog {
my $eventNum=0;
my ($eventArray,$lSize);
my $getFunc = Vim::get_service_content()->eventManager;
my $eventManager = Vim::get_view(mo_ref => $getFunc);
my $eventFilter = EventFilterSpecByTime->new(beginTime=>$startTime,endTime=>$stopTime);
my $filterSpec = EventFilterSpec->new(time=>$eventFilter);
my $collectorViewRef= $eventManager->CreateCollectorForEvents(filter=>$filterSpec);
my $collectorView = Vim::get_view(mo_ref => $collectorViewRef);
my $separator="\":\"";
my $separator2="\",\"";
while (1) {
$eventArray=$collectorView->ReadNextEvents(maxCount=>400);
my @evtArray = @{$eventArray};
if (not defined $eventArray) { last;}
$lSize = @evtArray;
if ($lSize>=1) {
foreach (@evtArray){
my $fullMsg = decode_utf8($_->fullFormattedMessage);
$fullMsg=~s/[^[:ascii:]]+//g;
$fullMsg=~s/[\n]+//g;
my $packetContent="{";
if (defined($_->createdTime)) {
$packetContent=$packetContent."\"EventTime".$separator.$_->createdTime.$separator2.
"Message".$separator.$fullMsg.$separator2.
"UserName".$separator.$_->userName."\"";
if ($startTime eq $_->createdTime) {next;}
$timeStamp=$_->createdTime;
}
if (defined($_->vm)) {
my $vmObj = $_->vm;
$packetContent=$packetContent.",\""."VirtualMachine".$separator.$vmObj->name."\"";
}
if (defined($_->host)) {
my $hostObj=$_->host;
$packetContent=$packetContent.",\""."HostName".$separator.$hostObj->name."\"";
}
$packetContent.="}\n";
print $packetContent;
$eventNum++;
}
}
else {
if (defined $timeStamp) {
$startTime = $timeStamp;
my $file = new IO::File("+> $timeStampFile");
$file->print($timeStamp);
$file->close();
}
last;
}
}
}