59. Elasticsearch and Kibana
Elasticsearch is a search engine and document database that is commonly used to store logging data. Kibana is a popular user interface and querying front-end for Elasticsearch. Kibana is often used with the Logstash data collection engine—together forming the ELK stack (Elasticsearch, Logstash, and Kibana).
However, Logstash is not actually required to load data into Elasticsearch. NXLog can do this as well, and offers several advantages over Logstash—this is the KEN stack (Kibana, Elasticsearch, and NXLog).
-
Because Logstash is written in Ruby and requires Java, it has high system resource requirements. NXLog has a small resource footprint and is recommended by many ELK users as the log collector of choice for Windows and Linux.
-
Due to the Java dependency, Logstash requires system administrators to deploy the Java runtime onto their production servers and keep up with Java security updates. NXLog does not require Java.
-
The EventLog plugin in Logstash uses the Windows WMI interface to retrieve the EventLog data. This method incurs a significant performance penalty. NXLog uses the Windows EventLog API natively in order to efficiently collect EventLog data.
The following sections provide details for configuring NXLog to:
-
send logs directly to Elasticsearch, replacing Logstash; or
-
forward collected logs to Logstash, acting as a log collector for Logstash.
59.1. Sending Logs to Elasticsearch
Consult the Elasticsearch Reference and the Kibana User Guide for more information about installing and configuring Elasticsearch and Kibana. For NXLog Enterprise Edition 3.x, see Using Elasticsearch With NXLog Enterprise Edition 3.x in the Reference Manual.
-
Configure NXLog.
Example 247. Using om_elasticsearchThe om_elasticsearch module is only available in NXLog Enterprise Edition. Because it sends data in batches, it reduces the effect of the latency inherent in HTTP responses, allowing the Elasticsearch server to process the data much more quickly (10,000 EPS or more on low-end hardware).
nxlog.conf![[Download file]](images/icons/download_icon.png "Download file")
  1
2
3
4
5
6
7
8
9
10
11
12
13
14
15
16

  <Extension _json>
    Module      xm_json
</Extension>

<Output out>
    Module      om_elasticsearch
    URL         http://localhost:9200/_bulk
    FlushInterval   2
    FlushLimit  100

    # Create an index daily
    Index       strftime($EventTime, "nxlog-%Y%m%d")

    # Use the following if you do not have $EventTime set
    #Index      strftime($EventReceivedTime, "nxlog-%Y%m%d")
</Output>
Example 248. Using om_httpFor NXLog Community Edition, the om_http module can be used instead to send logs to Elasticsearch. Because it sends a request to the Elasticsearch HTTP REST API for each event, the maximum logging throughput is limited by HTTP request and response latency. Therefore this method is suitable only for low-volume logging scenarios.
nxlog.conf1 2 3 4 5 6 7 8 9 10 11 12 13 14 15
<Extension _json> Module xm_json </Extension> <Output out> Module om_http URL http://localhost:9200 ContentType application/json <Exec> set_http_request_path(strftime($EventTime, "/nxlog-%Y%m%d/" + $SourceModuleName)); rename_field("timestamp", "@timestamp"); to_json(); </Exec> </Output>
-
Restart NXLog, and make sure the event sources are sending data. This can be checked with
curl -X GET
'localhost:9200/_cat/indices?v&pretty'
. There should be an index matchingnxlog*and itsdocs.countcounter should be increasing. -
Configure the appropriate index pattern for Kibana.
-
Open Management on the left panel and click on Index Patterns.
-
Set the Index pattern to
nxlog*. A matching index should be listed. Click > Next step.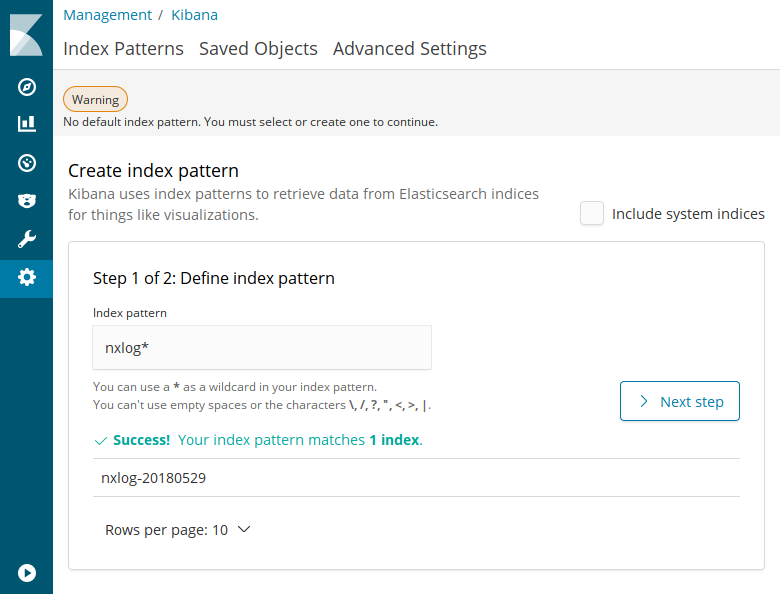
-
Set the Time Filter field name selector to
EventTime(orEventReceivedTimeif the$EventTimefield is not set by the input module). Click Create index pattern.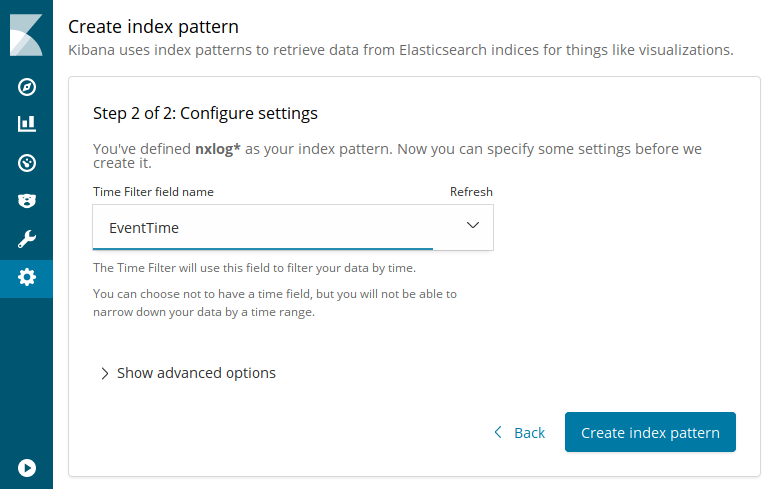
-
-
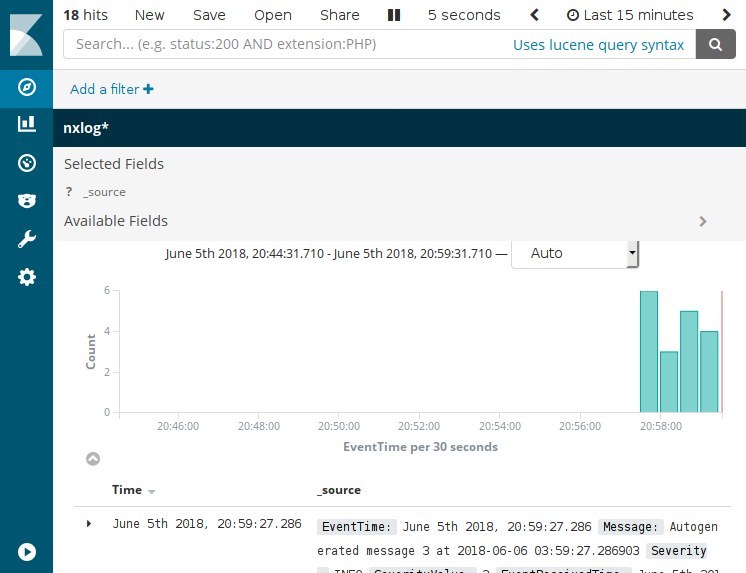
Test that the NXLog and Elasticsearch/Kibana configuration is working by opening Discover on the left panel.
59.2. Forwarding Logs to Logstash
NXLog can be configured to act as a log collector, forwarding logs to Logstash in JSON format.
-
Set up a configuration on the Logstash server to process incoming event data from NXLog.
logstash.confinput { tcp { codec => json_lines { charset => CP1252 } port => "3515" tags => [ "tcpjson" ] } } filter { date { locale => "en" timezone => "Etc/GMT" match => [ "EventTime", "YYYY-MM-dd HH:mm:ss" ] } } output { elasticsearch { host => localhost } stdout { codec => rubydebug } }NoteThe
jsoncodec in Logstash sometimes fails to properly parse JSON—it will concatenate more than one JSON record into one event. Use thejson_linescodec instead.Although the im_msvistalog module converts data to UTF-8, Logstash seems to have trouble parsing that data. The
charset => CP1252seems to help. -
Configure NXLog.
nxlog.conf1 2 3 4 5 6
<Output out> Module om_tcp Host 10.1.1.1 Port 3515 Exec to_json(); </Output>
-
Restart NXLog.