89. Splunk
Splunk is a software platform for data collection, indexing, searching, and visualization. NXLog can be configured as an agent for Splunk, collecting and forwarding logs to the Splunk instance. Splunk can accept logs forwarded via UDP, TCP, TLS, or HTTP.
For more information, see the Splunk Enterprise documentation. See also the Sending ETW Logs to Splunk with NXLog post.
89.1. Configuring Splunk
The following sections describe steps that may be required to prepare Splunk for receiving events from NXLog.
89.1.1. Adding a TCP or UDP Data Input
TCP or UDP log collection can be added from the web interface, however TLS encryption must be configured by editing configuration files.
-
Add a new data input.
-
On the Splunk web interface, go to Settings > Data inputs.
-
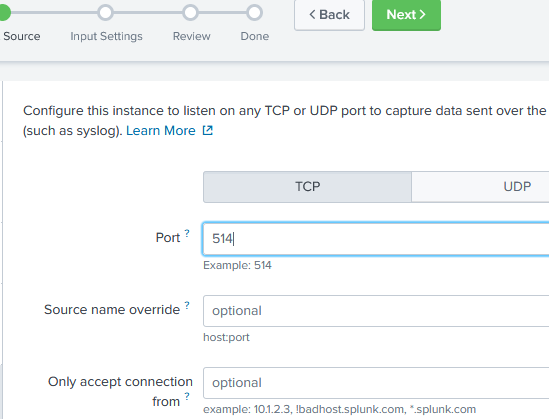
In the Local inputs section, for the TCP (or UDP) input type, click Add new.
-
Enter the Port on which to listen for log data (for example, port 514).
-
Fill in the remaining values, if required, and click Next.
-
-
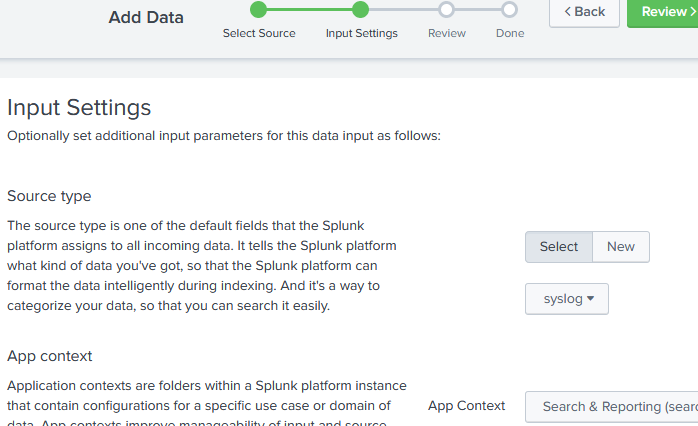
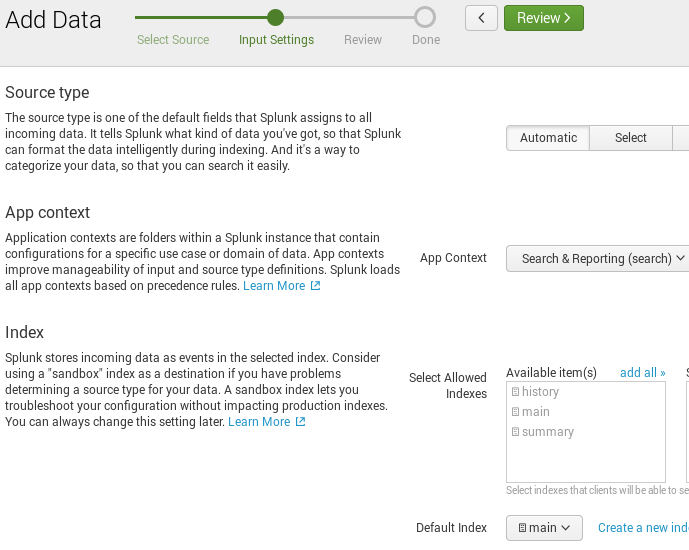
Configure the input settings.
-
Select the Source type appropriate for the logs to be sent. For more information, see the Sending Generic Structured Logs and Sending Specific Log Types for Splunk to Parse sections below.
-
Choose an App context; for example, Search & Reporting (search).
-
Adjust the remaining default values, if required, and click Review.
-
-
Review the pending changes and click Submit.
89.1.2. Configuring TLS Collection
Follow these steps to set up TLS collection.
-
In order to generate certificates, issue the following commands from the server’s console. The script will ask for a password to protect the key.
$ mkdir /opt/splunk/etc/certs $ export OPENSSL_CONF=/opt/splunk/openssl/openssl.cnf $ /opt/splunk/bin/genRootCA.sh -d /opt/splunk/etc/certs $ /opt/splunk/bin/genSignedServerCert.sh -d /opt/splunk/etc/certs -n splunk -c splunk -p -
Go to the app’s folder and edit the inputs file. For the Search & Reporting app, the path is
$SPLUNK_HOME/etc/apps/search/local/inputs.conf. Add[tcp-ssl]and[SSL]sections.inputs.conf[tcp-ssl://10514] disabled = false sourcetype = <optional> [SSL] serverCert = /opt/splunk/etc/certs/splunk.pem sslPassword = <The password provided in step 1> requireClientCert = false -
Edit the
$SPLUNK_HOME/etc/system/local/server.conffile, adding asslRootCAPathvalue to the[sslConfig]section.server.conf[sslConfig] sslPassword = <Automatically generated> sslRootCAPath = /opt/splunk/etc/certs/cacert.pem -
Finally, restart Splunk in order to apply the new configuration.
$ $SPLUNK_HOME/bin/splunk restart splunkd -
Setup can be tested with
netstator a similar command. If everything went correctly, the following output is produced.$ netstat -an | grep :10514 tcp 0 0 0.0.0.0:10514 0.0.0.0:* LISTEN -
Copy the
cacert.pemfile from$SPLUNK_HOME/etc/certsto the NXLog certificate directory.
This configuration illustrates how to send a log file via a TLS-encrypted connection. The AllowUntrusted setting is required in order to accept a self-signed certificate.
  1
2
3
4
5
6
7

  <Output out>
    Module          om_ssl
    Host            127.0.0.1
    Port            10514
    CertFile        %CERTDIR%/cacert.pem
    AllowUntrusted  TRUE
</Output>
89.1.3. Configuring HTTP Event Collection (HEC)
HTTP Event Collection can gather events, as JSON-formatted or as raw data, via HTTP/HTTPS. HEC is a stateless, high performance, token-based solution that is easy to scale with a load balancer. Furthermore, it offers token-based authentication. For more information about configuring and using HEC, see the following on Splunk Docs: Set up and use HTTP Event Collector in Splunk Web, Format events for HTTP Event Collector, and Input endpoint descriptions.
By default, HEC is disabled. To enable, follow these steps:
-
Open Settings > Data inputs and click on the HTTP Event Collector type.
-
Click the Global Settings button (in the upper-right corner).
-
For All Tokens, click the Enabled button.
-
Optionally, set the Default Source Type, Default Index, and Default Output Group settings.
-
Check Enable SSL to require events to be sent encrypted (recommended). See Configuring TLS Collection.
-
Change the HTTP Port Number if required, or leave it set to the default port 8088.
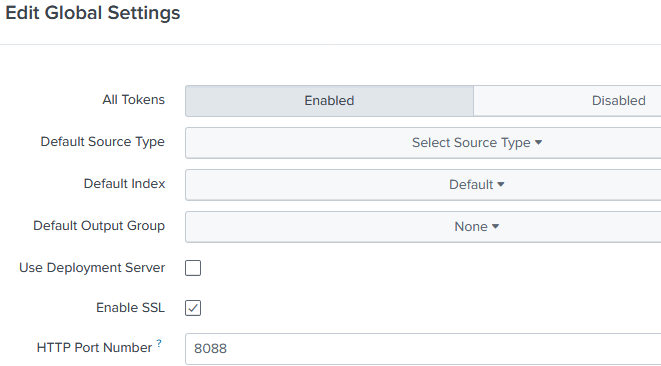
-
Click Save.
Once HEC is enabled, add a new token as follows:
-
If not already on the HTTP Event Collector page, open Settings > Data inputs and click on the HTTP Event Collector type.
-
Click New Token.
-
Enter a name for the token and modify any other settings if required; then click Next.
-
For the Source type, choose Automatic. The source type will be specified using an HTTP header as shown in the examples in the following sections.
-
Choose an App context; for example, Search & Reporting (search).
-
Adjust the remaining default values, if required, and click Review.
-
Verify the information on the summary page and click Submit. The HEC token is created and its value is presented.
-
The configuration can be tested with the following command (substitute the correct token):
$ curl -k https://<host>:8088/services/collector \
       -H 'Authorization: Splunk <token>' -d '{"event":"test"}'
If configured correctly, Splunk will respond that the test event was delivered.
{"text":"Success","code":0}
89.2. Sending Generic Structured Logs
NXLog can be configured to send generic structured logs to Splunk in JSON format.
89.2.1. Sending Structured Logs via HEC
Events can be sent to the HEC standard /services/collector endpoint using a
specific nested JSON format. In this way, multiple input instances can be used
to gather log data, and everything forwarded using a single output instance.
The HEC uses a JSON event format, with event data in the event key and
additional metadata sent in time, host, source, sourcetype, index,
and fields keys. For details about the format, see
Format
events for HTTP Event Collector on Splunk Docs and in particular, the
Event
metadata section there. Because the source type is specified in the event
metadata, it is not necessary to set the source type on Splunk or to use
separate tokens for different source types.
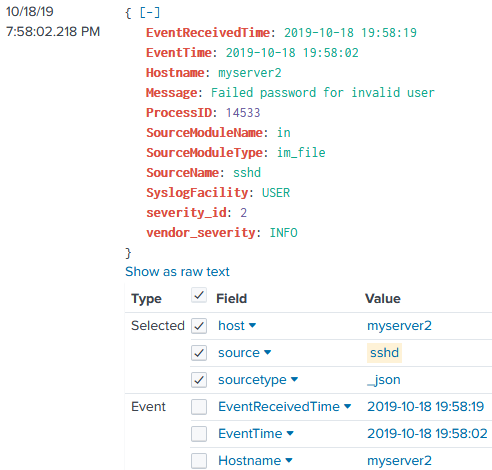
This example shows an output instance that uses the xm_json and
om_http modules to send the data to the HEC. Events are formatted
specifically for the HEC standard /services/collector endpoint.
  1
2
3
4
5
6
7
8
9
10
11
12
13
14
15
16
17
18
19
20
21
22
23
24
25
26
27
28
29
30
31
32
33
34
35
36
37
38
39
40
41

  <Extension _json>
    Module  xm_json
</Extension>

<Extension clean_splunk_fields>
    Module  xm_rewrite
    Keep    time, host, source, sourcetype, index, fields, event
</Extension>

<Output out>
    Module      om_http
    URL         https://127.0.0.1:8088/services/collector
    AddHeader   Authorization: Splunk c6580856-29e8-4abf-8bcb-ee07f06c80b3
    HTTPSCAFile %CERTDIR%/cacert.pem
    <Exec>
        # Rename event fields to what Splunk uses
        if $Severity rename_field($Severity, $vendor_severity);
        if $SeverityValue rename_field($SeverityValue, $severity_id);

        # Convert all fields to JSON and write to $event field
        $event = to_json();

        # Convert $EventTime to decimal seconds since epoch UTC
        $time = string(integer($EventTime));
        $time =~ /^(?<sec>\d+)(?<ms>\d{6})$/;
        $time = $sec + "." + $ms;

        # Specify the log source type
        $sourcetype = "_json";

        # Add other HEC metadata fields if available in the event data
        if $Hostname $host = $Hostname;
        if $SourceName $source = $SourceName;

        # Remove all non-metadata fields (already stored in $event)
        clean_splunk_fields->process();

        # Write to JSON
        to_json();
    </Exec>
</Output>
{
  "event": {
    "EventReceivedTime": "2019-10-18 19:58:19",
    "SourceModuleName": "in",
    "SourceModuleType": "im_file",
    "SyslogFacility": "USER",
    "vendor_severity": "INFO",
    "severity_id": 2,
    "EventTime": "2019-10-18 19:58:02",
    "Hostname": "myserver2",
    "ProcessID": 14533,
    "SourceName": "sshd",
    "Message": "Failed password for invalid user"
  },
  "time": "1571428682.218749",
  "sourcetype": "_json",
  "host": "myserver2",
  "source": "sshd"
}
89.2.2. Sending Structured Logs via TCP/TLS
It is also possible to send JSON-formatted events to Splunk via TCP or TLS. To extract fields and index the event timestamps as sent by the configuration below, add a new source type with the corresponding settings:
-
Open Settings > Source types.
-
Find the
_jsonsource type and click Clone. -
Provide a name for the new source type, such as
nxlog_json. -
Under the Advanced tab, add the following configuration values:
Name Value TIME_PREFIX"time":"TIME_FORMAT%s.%6N
Then select this new source type the TCP data input, as described in Adding a TCP or UDP Data Input.
This configuration sets the $time
field for Splunk, converts the event data to JSON with the xm_json
to_json() procedure, and forwards via TCP with the
om_tcp module.
  1
2
3
4
5
6
7
8
9
10
11
12
13
14
15
16
17
18
19
20

  <Extension _json>
    Module  xm_json
</Extension>

<Output out>
    Module  om_tcp
    Host    127.0.0.1
    Port    514
    <Exec>
        # Convert $EventTime to decimal seconds since epoch UTC
        $time = string(integer($EventTime));
        $time =~ /^(?<sec>\d+)(?<ms>\d{6})$/;
        $time = $sec + "." + $ms;
        delete($sec);
        delete($ms);

        # Write to JSON
        to_json();
    </Exec>
</Output>
{
  "EventReceivedTime": "2019-09-30T20:00:01.448973+00:00",
  "SourceModuleName": "in",
  "SourceModuleType": "im_file",
  "SyslogFacility": "USER",
  "vendor_severity": "INFO",
  "severity_id": 2,
  "EventTime": "2019-10-03T05:36:58.190689+00:00",
  "Hostname": "myserver2",
  "ProcessID": 14533,
  "SourceName": "sshd",
  "Message": "Failed password for invalid user",
  "time": "1570081018.190689"
}
89.3. Sending Specific Log Types for Splunk to Parse
Splunk implements parsing for a variety of log formats, and apps available on Splunkbase provide support for additional log formats. So in some cases it is most effective to send the raw logs and allow Splunk to do the parsing.
89.3.1. Forwarding Windows Event Log as XML
Windows Event Log data can be forwarded to Splunk in XML format. The "Splunk Add-on for Microsoft Windows" provides log source types for parsing this format.
|
Note
|
These instructions have been tested with Splunk 7.3.1.1 and the "Splunk Add-on for Microsoft Windows" version 6.0.0. |
-
Install the Splunk Add-on for Microsoft Windows. See About installing Splunk add-ons on Splunk Docs for more details.
-
Configure the log source type as XmlWinEventLog.
-
Optionally, add a configuration value to use the event
SystemTimevalue as Splunk’s event_timeduring indexing (otherwise Splunk will fall back to using the received time). This can be added to the specific event source or to the XmlWinEventLog source type. To modify the XmlWinEventLog source type from the Splunk web interface, follow these steps:-
Open Settings > Source types.
-
Find the XmlWinEventLog source type (uncheck Show only popular) and click Edit.
-
Open the Advanced tab and add the following configuration value:
Name Value EVAL-_timestrptime(SystemTime, "'%Y-%m-%dT%H:%M:%S.%9N%Z'")
-
-
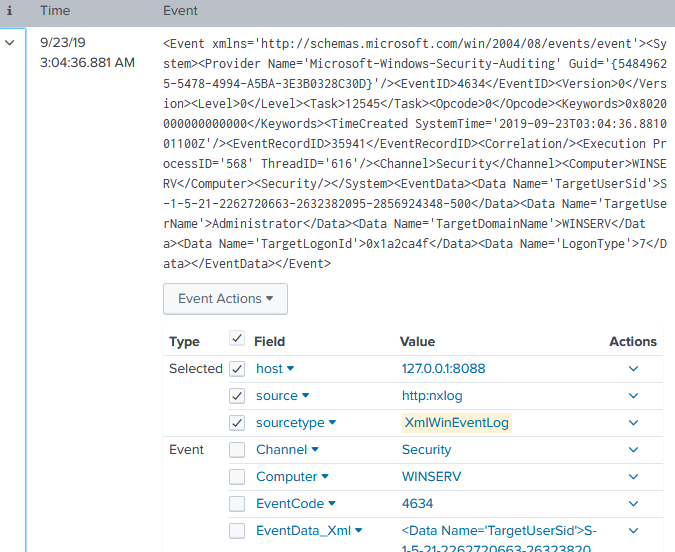
Use the im_msvistalog CaptureEventXML directive to capture the XML-formatted event data from the Event Log. Forward this value to Splunk.
This example reads events from the Security channel. With the
CaptureEventXML directive set to
TRUE, the XML event data is stored in the
$EventXML field. The contents of this field
are then assigned to the $raw_event field, which sent is to Splunk by the
the splunk_hec output instance.
  1
2
3
4
5
6
7
8
9
10
11
12

  <Input eventxml>
    Module          im_msvistalog
    Channel         Security
    CaptureEventXML TRUE
    Exec            $raw_event = $EventXML;
</Input>

<Output splunk_hec>
    Module      om_http
    URL         https://127.0.0.1:8088/services/collector/raw
    AddHeader   Authorization: Splunk c6580856-29e8-4abf-8bcb-ee07f06c80b3
</Output>
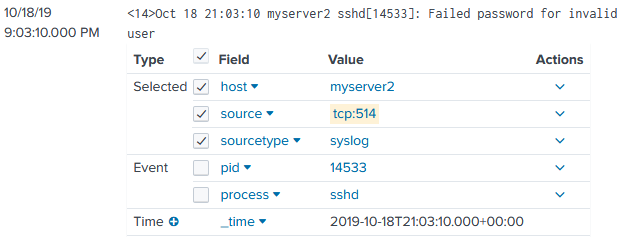
Events should be automatically parsed by Splunk as shown below.
89.3.2. Sending BSD Syslog Data to Splunk
Splunk can parse BSD Syslog events, so in this case it is not necessary to do any additional parsing with NXLog. The source type should be set to syslog.
In this example, events in Syslog format are read from file and sent to Splunk via TCP with no additional processing. Because the source type is set to syslog, Splunk automatically parses the Syslog header metadata.
  1
2
3
4
5
6
7
8
9
10

  <Input syslog>
    Module  im_file
    File    '/var/log/messages'
</Input>

<Output splunk>
    Module  om_tcp
    Host    10.10.1.12
    Port    514
</Output>