114. Dashboard and Menu
114.1. Logging in
After installing and starting NXLog Manager, open a browser and go to the URL of the application (http://localhost:9090, if the default values were used during installation). The login screen is displayed:
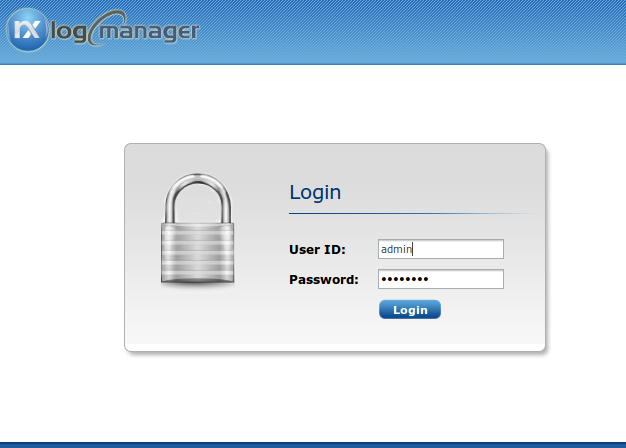
NXLog Manager ships with one built-in administrator account. The User ID is admin and the password is nxlog123. This default password should be changed as soon as possible.
114.2. The Menu Bar
After logging in, the dashboard and main menu are displayed.

|
Note
|
Menu items are shown or hidden based on the current user’s configured roles. See Roles for more information about access control in NXLog Manager. |
The successive chapters are organized to cover each of these components which can be accessed from the menu.
114.3. Dashboard
On the first login, the following screen appears.
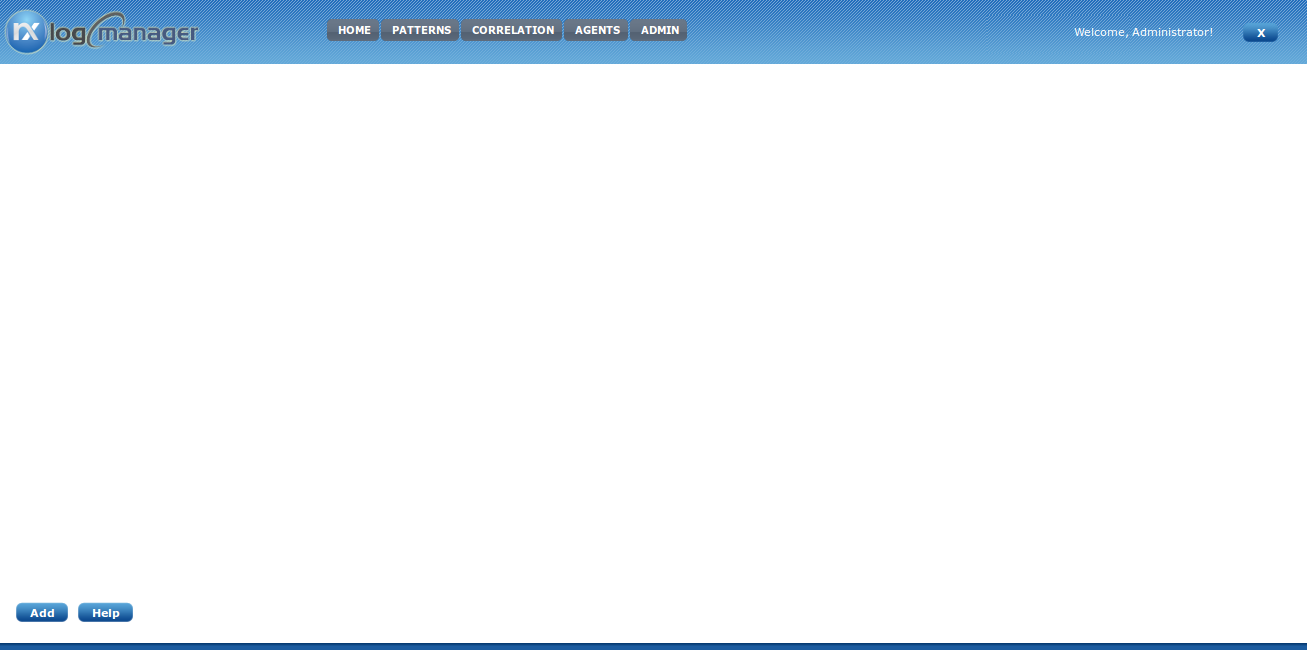
The dashboard can be customized and displays content accessible to the logged in user. After clicking the Add button, an empty dashboard item will appear:
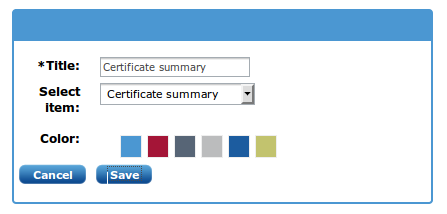
The following item types can be selected with the combo box:
- Agent list
-
The number of agents are displayed for each category:
-
Online
-
Offline
-
Error
-
Unmanaged
See the Agents chapter for more information about agent statuses.
-
- Jobs summary
-
Will display a summary about scheduled jobs.
- Certificate summary
-
Will display a summary about certificates grouping them by the following categories:
-
Expired
-
To be expired in the next 10 days
-
Revoked
-
Valid
See the Certificates chapter for more information.
-
- Agent chart
-
Will display one of these agent charts for an agent:
-
Load average and memory usage
-
Overall event count
-
Event count of a separate modules
-
Module variables and statistical counters, when such are configured in agent statistics page
-
After the required parameters are filled in, click Save to add the item to the dashboard. Click Cancel if you wish to discard the dashboard item.
The header bar of the dashboard item can be clicked to drag and move the dashboard item around.

The following items are on the header bar, from left to right:
- Up arrow (▲)
-
Click to maximize the dashboard item.
- Edit
-
Click to edit the dashboard item.
- ✕
-
Click to remove the dashboard item.
- Title
-
The title provided in the last edit of the dashboard item.
- Down arrow (▼)
-
Click the down arrow in the top right corner to minimize the dashboard item.